

There are at least three apparent advantages of digital sales channels.
First, online offers can be more agile and be modified more flexibly—with dynamic pricing, e.g., depending on competitor prices or demand. Second, online offers can be individually adapted to the needs and preferences of your customers: You can play out the appropriate offer based on the customer’s current equipment, use relevant arguments for especially that customer type and meet the specific requirements of the customer along their customer journey (keyword: omnichannel). And last but not least, digital channels are often more cost-effective. Therefore, they are the focus of many cost-saving initiatives.
Like all offline touchpoints, digital channels have a primary goal: they are designed “to make customers decided”.
This happens on three levels:
- Motivation: The touchpoint must address existing needs and preferences, i.e., offer the customer the solution he is currently looking for.
- Cognition: The customer must understand the information conveyed, evaluate it as relevant, and find it convincing.
- Behaviour: The touchpoint must pave the way for the (purchase) decision and make it as easy as possible for the customer to decide.
Behavioral Economics provides a series of precise recommendations to help customers make decisions, e.g., based on an intelligent product and portfolio presentation via these three levels. Experimental A/B tests usually provide the proof of concept in these cases; the intelligence lies in the design of the stimuli. Minor adjustments can achieve conversion increases of two to three-digit percentage ranges.
BEAT Maps (Behavioral Economics Activity Tracking Maps) enrich the results of experimental tests even further with additional information quickly and effectively by simple means. These include information on how the customer can be better motivated to buy, e.g., on a landing page.
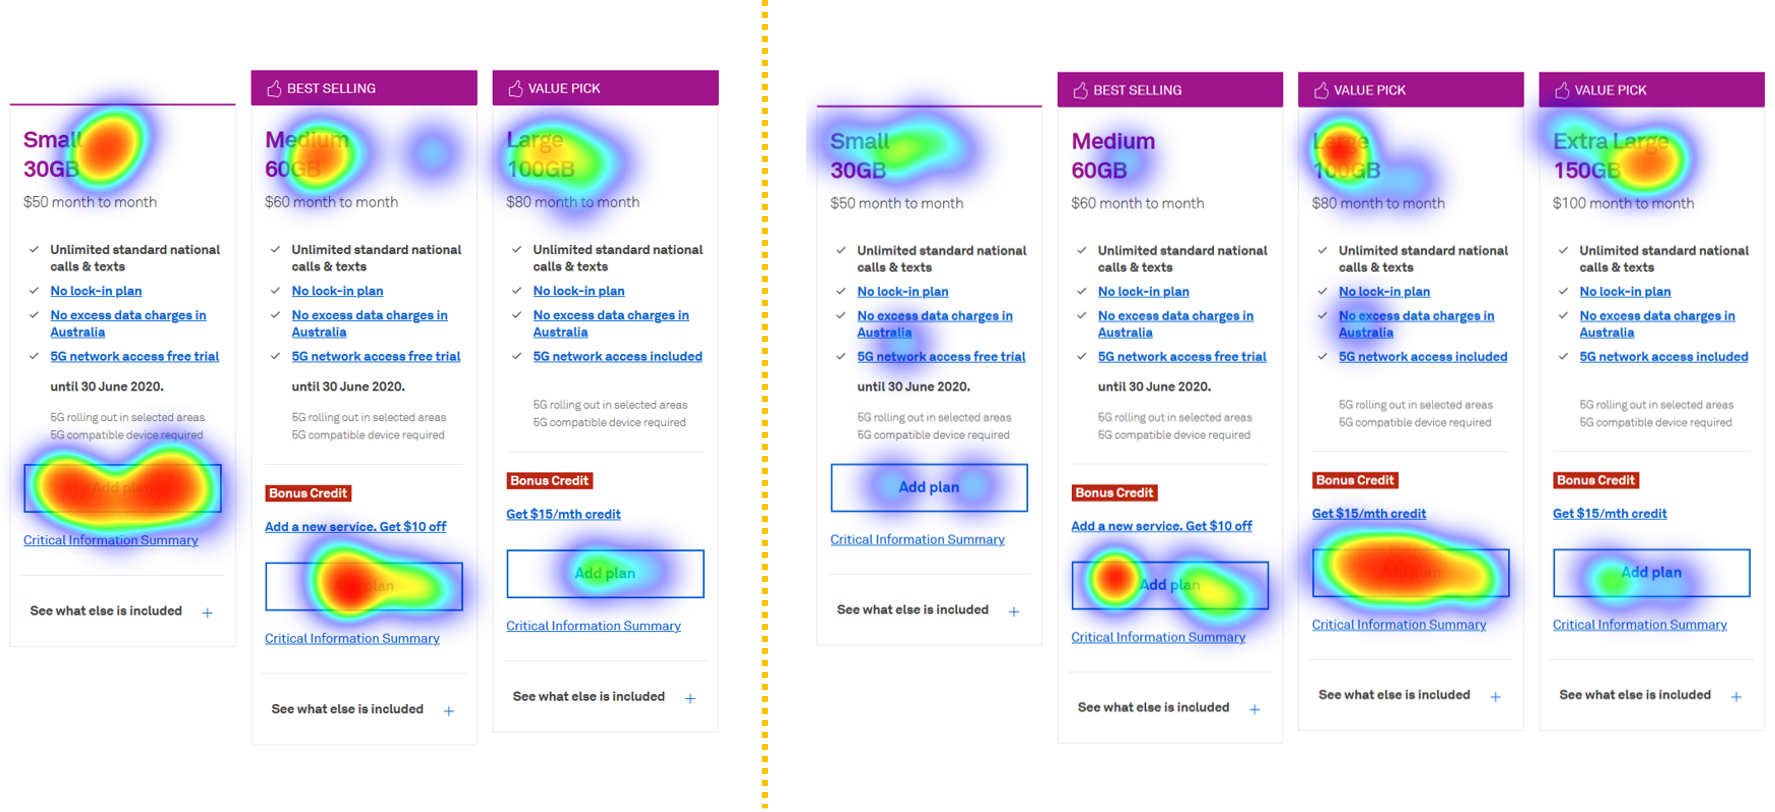
This example of BEAT Maps presenting two online stores shows how a classic three-tier portfolio (left) is perceived in comparison to a four-tier portfolio with an expensive anchor tariff.
It shows:
- whether the online store meets the customers’ needs and preferences (motivation),
- how customers perceive and process the information (cognition),
- whether they facilitate or inhibit the decision (behavior)
BEAT Maps thus provide causes for the results measured in A/B testings and give essential information for optimization. As a result, they combine the best of both worlds:
- High agility and validity of experimental A/B tests
- Identification of causes and specific potential for improvement
BEAT Maps are therefore suitable for various purposes, e.g.:
- Further development of apps, landing pages, portfolios, and other digital touchpoints
- A quick test of analog and digital communication media such as mailings and campaigns
Would you like to learn more about the use of BEAT Maps? Contact us! We will gladly exchange information with you.
Please subscribe to our newsletter for regular updates on behavioral economics, pricing, and selling.